Chapter 2 Kinetic EFM Configuration
Prerequisites
Ensure you have completed all the steps in the following documents before continuing:
Allow the Local Broker to Connect Upstream
- Open the remote broker EFM System Administrator web interface at
https://R_BROKER_IP:8443/efm-admin(replacingR_BROKER_IPwith your remote broker’s public IP address) and log in as theefmAdminuser with the password that was set during installation (kinetic123)
It is safe to ignore the SSL warning since this lab uses self-signed SSL certificates. In production the EFM server would be provisioned with a valid SSL certificate.
Once you log in, the “radiation”-style warning in the upper right-hand of the page indicates that there are downstream brokers in quarantine.
- Navigate to
Permissions > Quarantine > Authorize - Select the local broker from the list and click the
Authorizebutton at the bottom
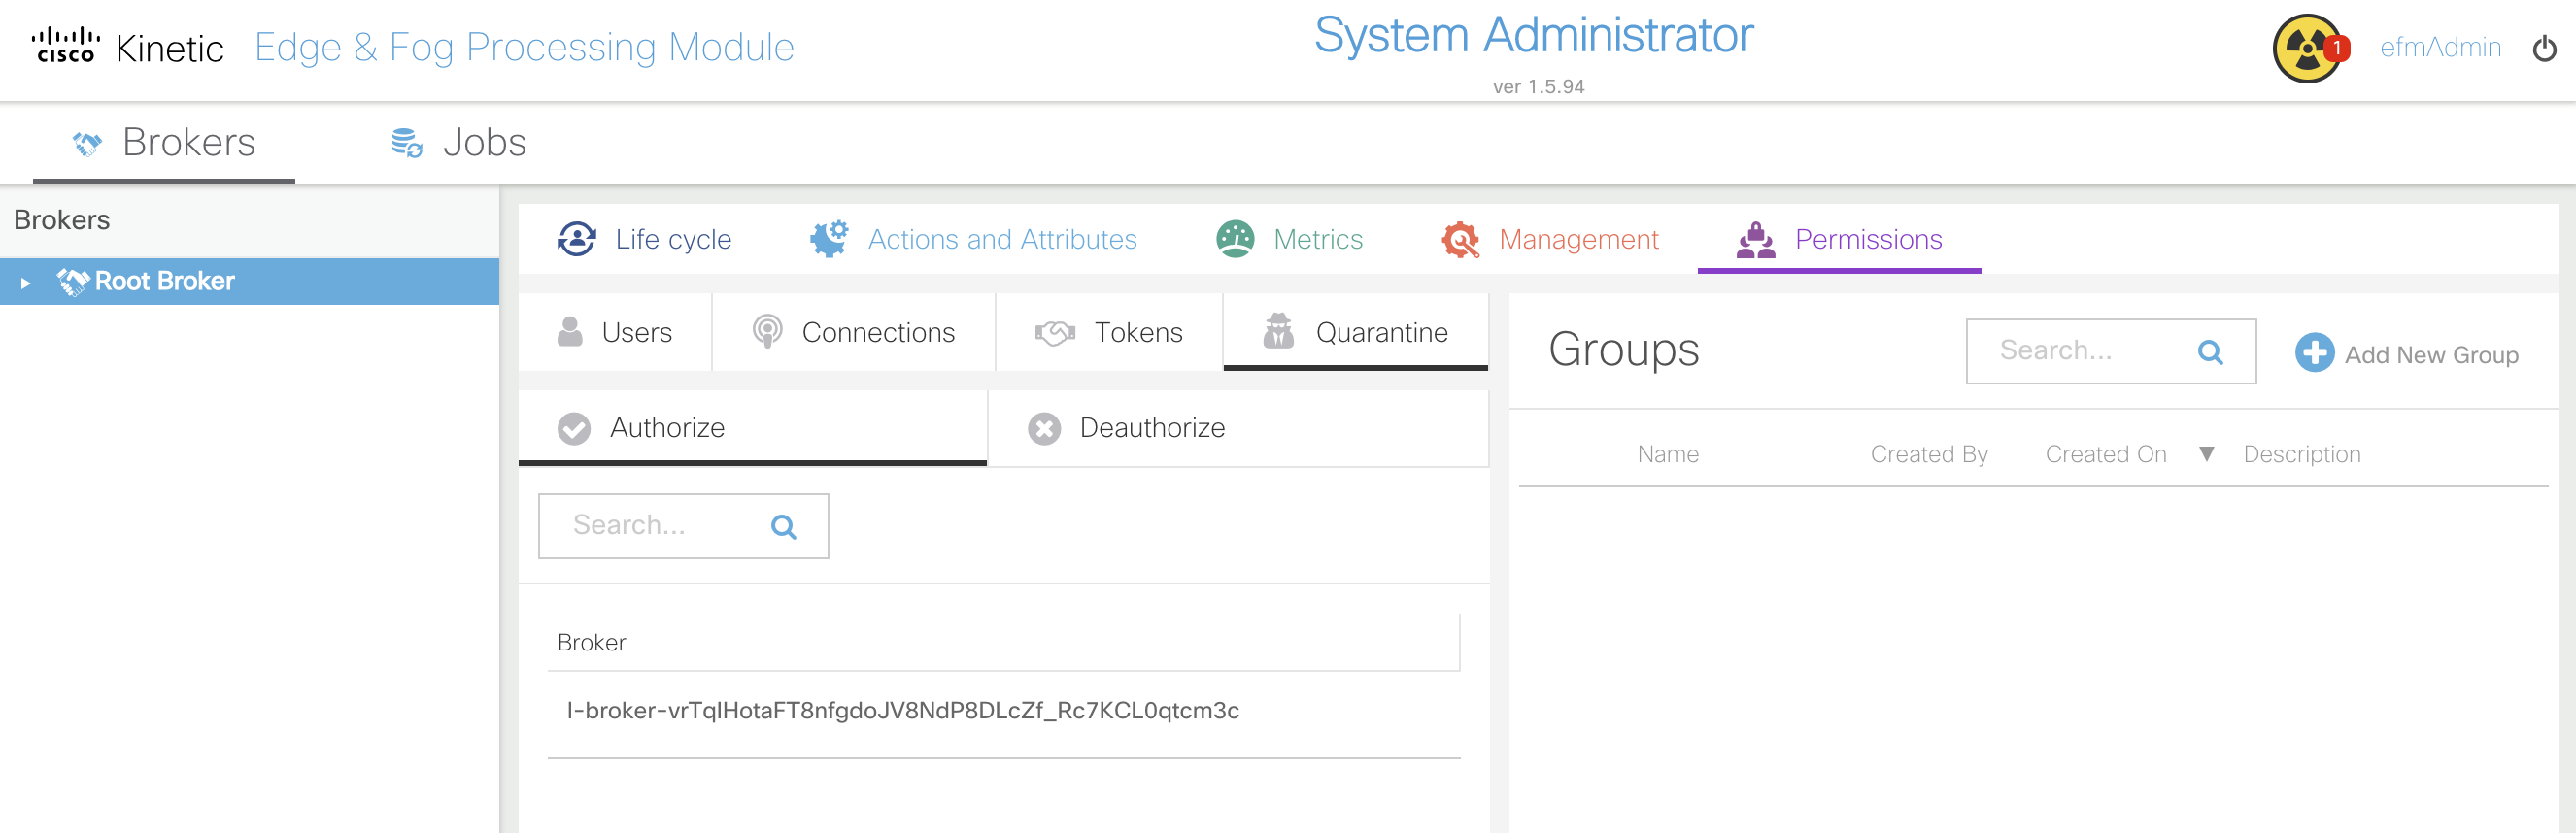
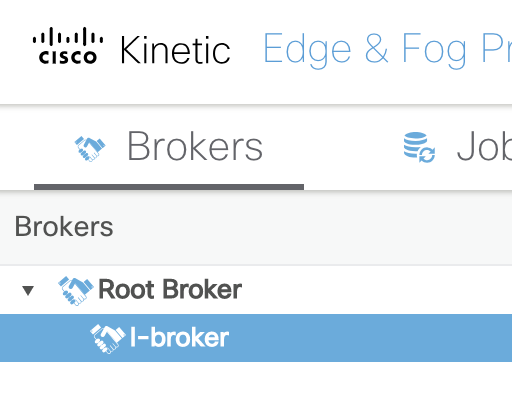
You should now see the local broker
l-brokerlisted underneath theRoot Brokerin theBrokerssection on the left-hand of the page.
- Select
l-brokerfrom theBrokerssection
Add DSLinks to the Local Broker
MQTT DSLink
- Navigate to
Management > links > Install Link - Select
MQTTfrom thelinkdropdown - Enter
mqttas the name and clickInvoke

It should say success True if the operation was successful.
- Navigate to
Management > links > mqtt > Start Link - Click
Invoke

Configure Local Broker DSLinks
MQTT
- Open the remote broker EFM Dataflow Editor web interface at
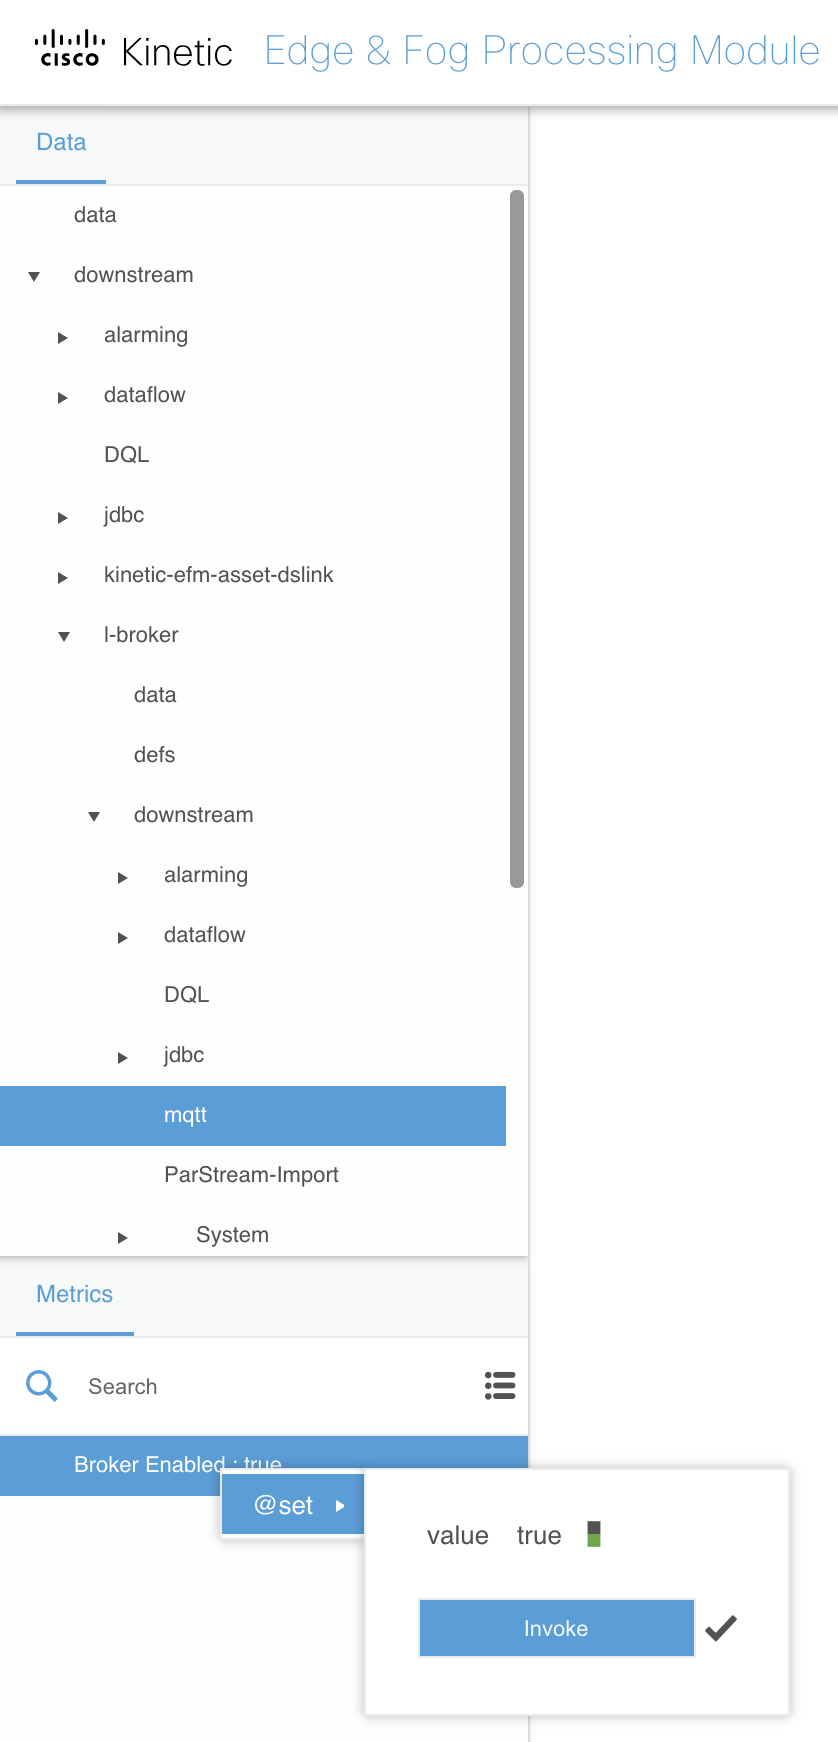
https://R_BROKER_IP:8443/dataflow.html(replacingR_BROKER_IPwith your remote broker’s public IP address) and log in again as theefmAdminuser, if prompted - Navigate to
Data > downstream > l-broker > downstream > mqtt - Under
Metricsright-click onBroker Enabled: false, set the value totrue, and clickInvoke
- Right-click on
mqttand selectAdd Server - Use the following options:
- name:
local-broker - url:
tcp://localhost - clientId:
l-broker - Click
Invoke
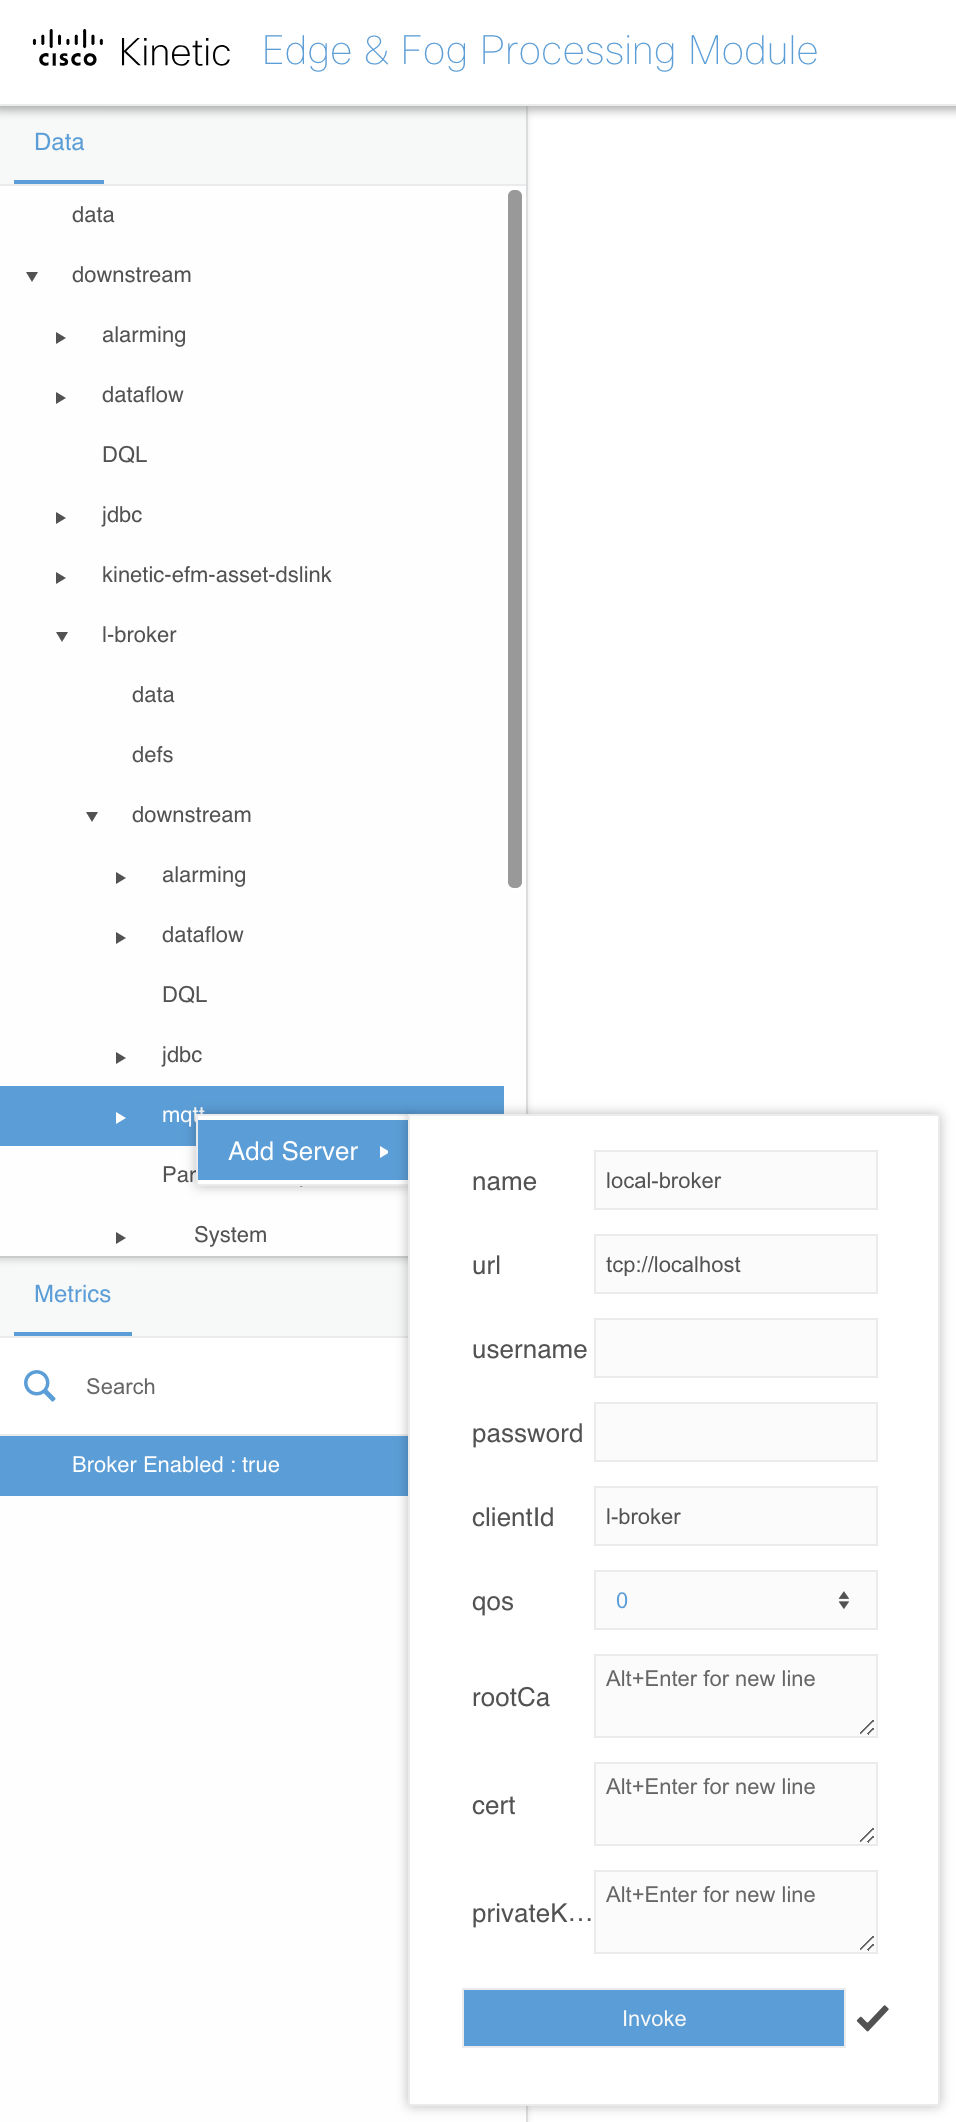
You don’t need to delete the example placeholder url of
tcp://test.mosquitto.org/. Just start typing in that field with the correct value and it will replace that setting. You will run into this with other EFM configuration dialogs as well.
You should see your station’s Raspberry Pi status LEDs turn from red to green after enabling the MQTT server on the local broker.
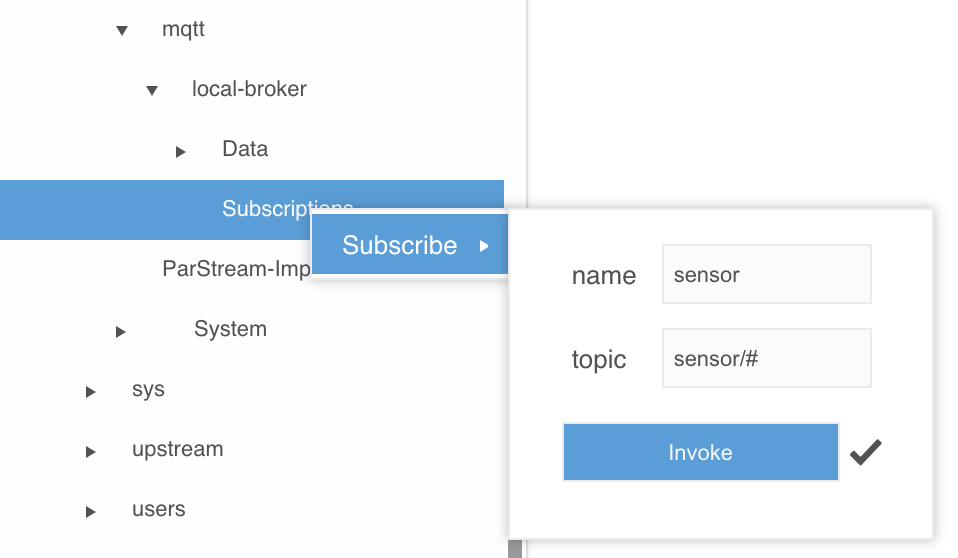
- Expand
... > mqtt > local-broker > Subscriptions
This
... >convention means to stay where you were in theDatasection, but to dive deeper into the hierarchy. It saves rewriting the entire path when you are not changing your broker focus. In this case, the...meansData > downstream > l-broker > downstream
- Right-click on
Subscriptionsand selectSubscribe - Use the following options:
- name:
sensor - topic:
sensor/# - Click
Invoke
- Subscribe to another MQTT channel with the following options:
- name:
control - topic:
control/# - Click
Invoke

The active MQTT channel subscriptions will show up under the Metrics section.
- Select
... > l-broker > downstream > dataflow - Right-click on
dataflowand selectCreate Dataflow - Name the dataflow
clear-local-mqtt-logsand clickInvoke

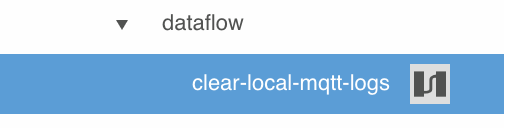
- Expand
... > dataflow > clear-local-mqtt-logs - Open the
clear-local-mqtt-logsdataflow in the right-hand editor workspace by clicking on its dataflow icon
- Expand
... > l-broker > sys > links > mqtt - Right-click on
mqtt, navigate toLog, and then dragClearto the editor workspaceDataflowsection
It may not be obvious exactly how to perform this step. You will left-click and hold the
Clearmenu entry, drag it to the editor workspace, and then let go of the left mouse or touchpad button.
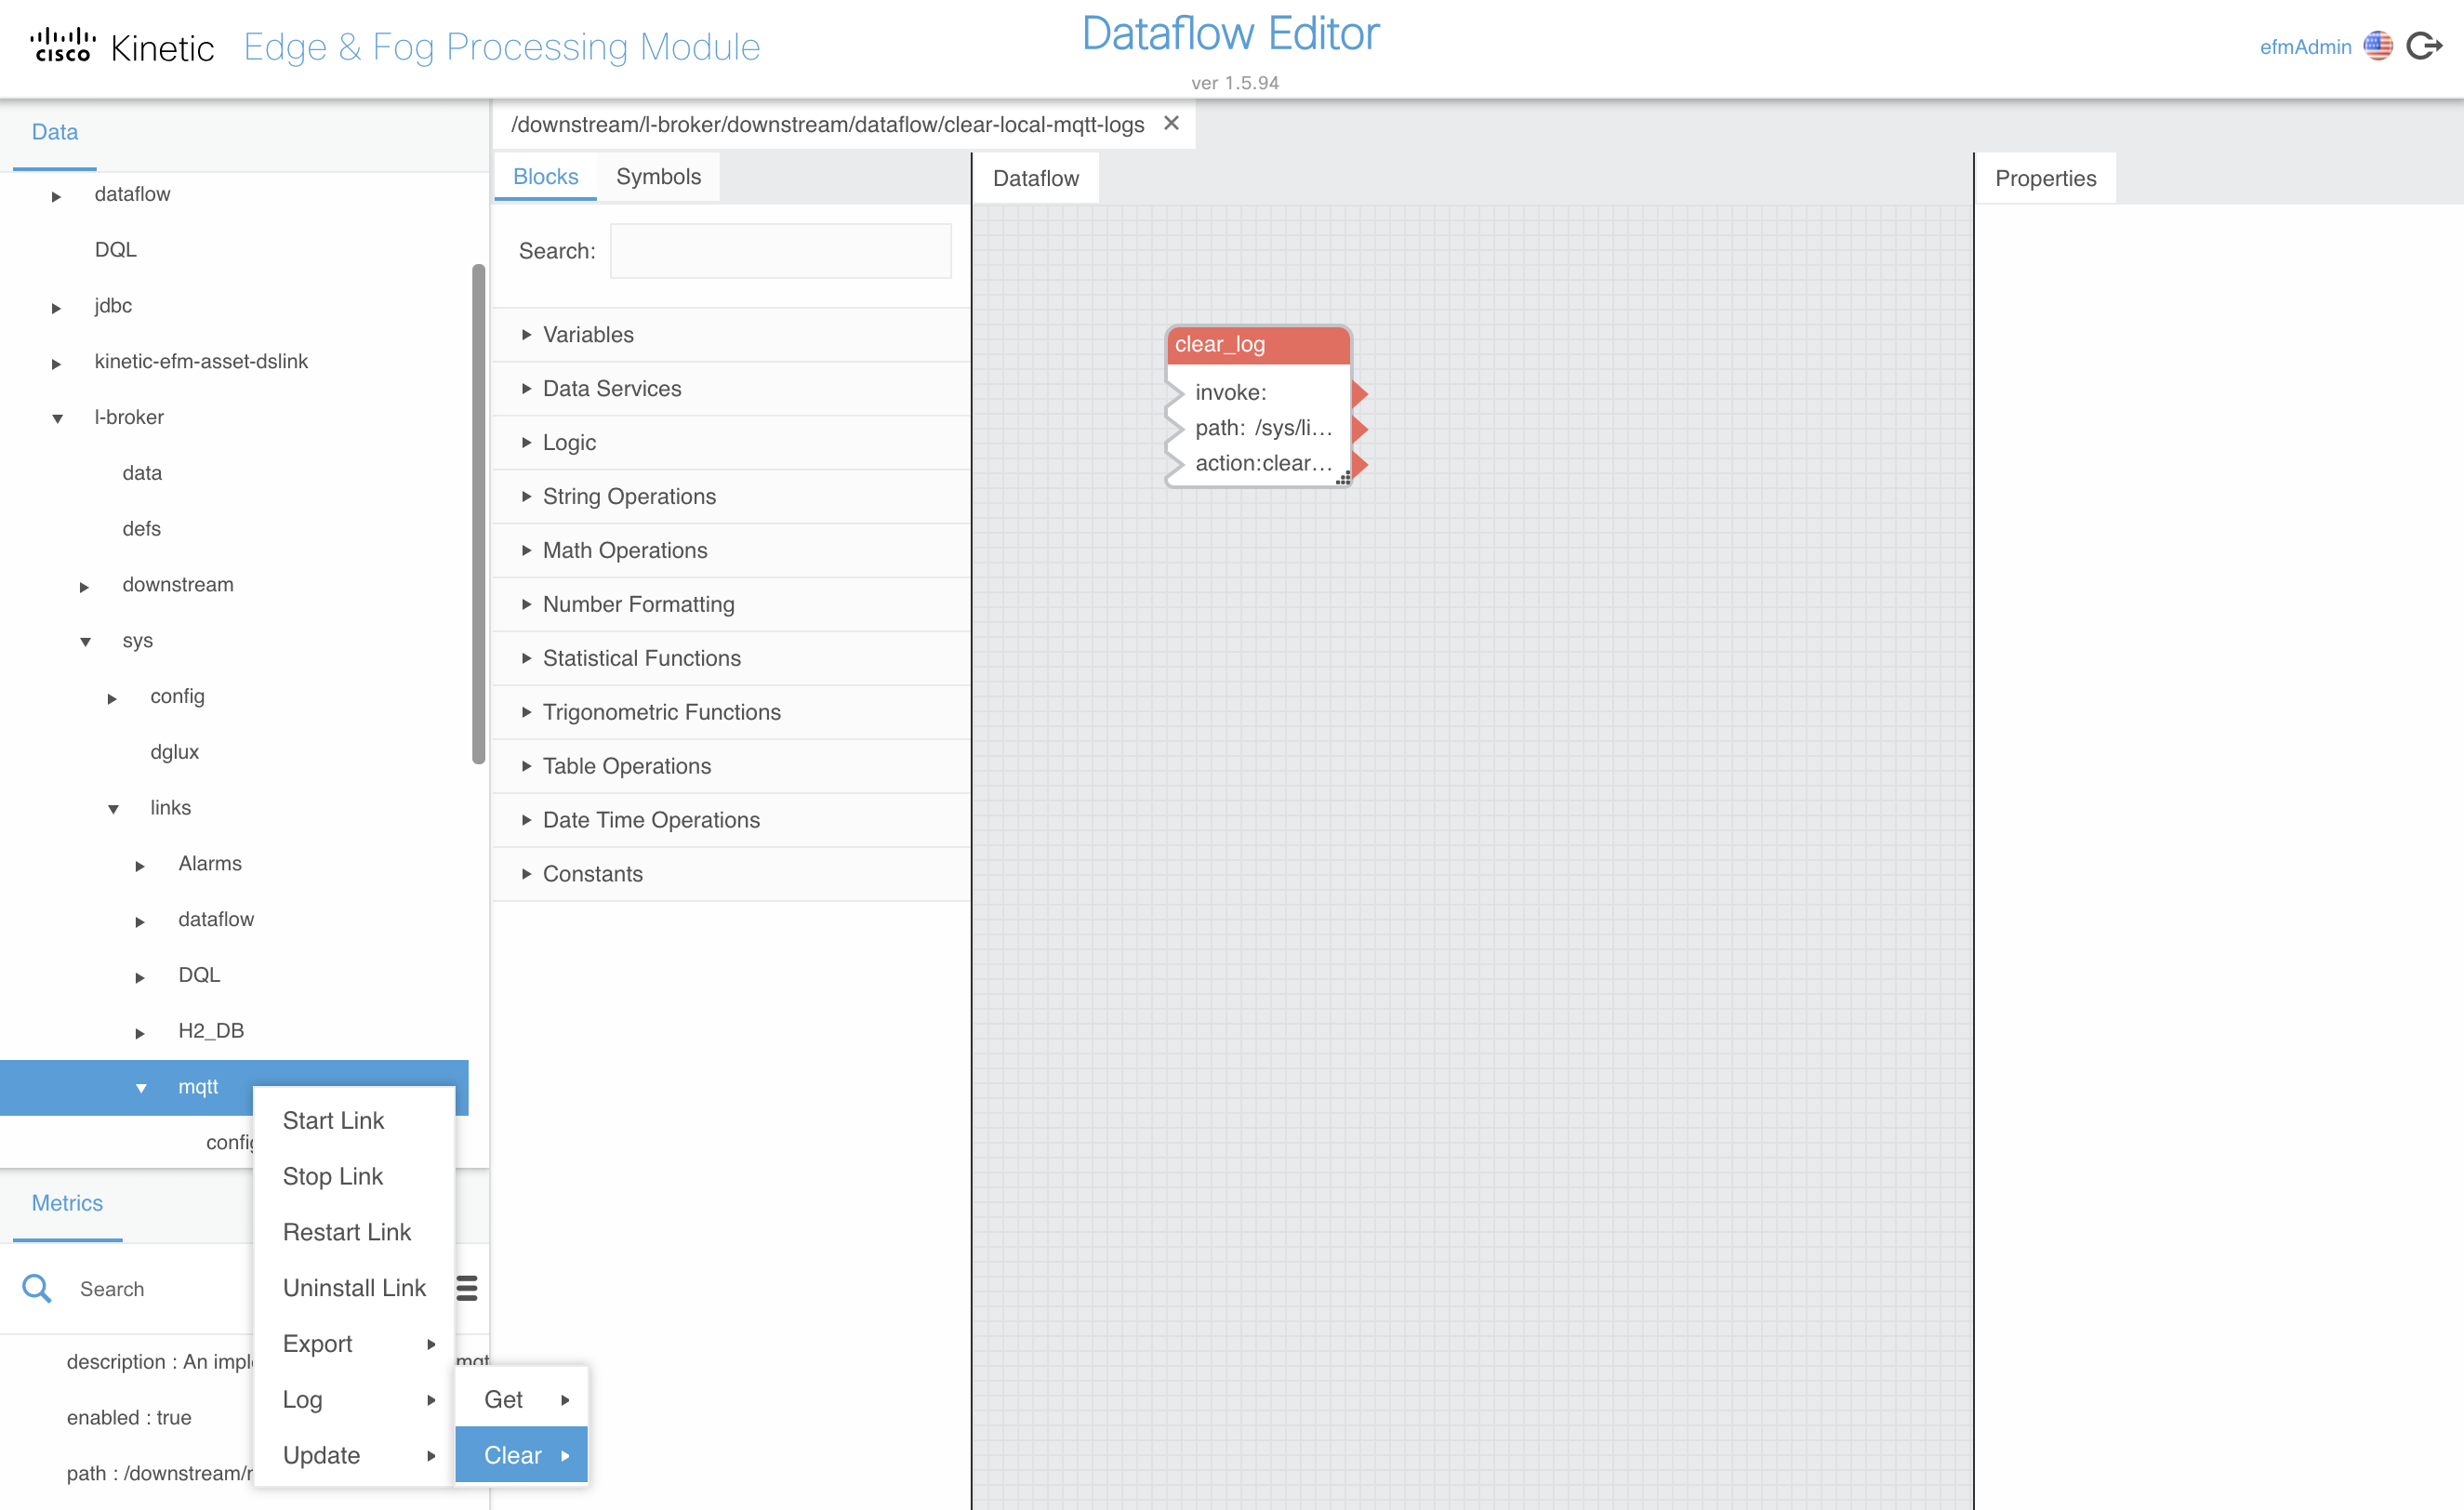
This is a process you will become very familiar with: dragging various functional “blocks” to the editor workspace to build a dataflow, editing their properties, and connecting their inputs and outputs. This is essentially graphical programming and as you will see can perform fairly complex logic and data operations.
- Double-click on the new block and rename
clear_logtoclear-mqtt-log - Edit the following values in the right-hand
Propertiessection:
- interval:
600 - autoRun:
true

As you likely have already figured out, this
clear-local-mqtt-logsdataflow will clear the MQTT log every 10 minutes. Without this in place the default MQTT DSLink log level would eventually fill up the small amount of storage with embedded platforms like the IR829. This isn’t as much of a concern with our UCS-based installation, but is a good example of how even the built-in capabilities of EFM can be leveraged and extended via custom dataflows.
You can see this log in the EFM System Administrator web interface under the
Life cyclesection for thel-brokerbroker’smqttlink.

- Close the
clear-local-mqtt-logsdataflow by clicking thexicon next to its name above the editor workspace
