Chapter 3 Local Kinetic EFM Dataflows
Prerequisites
Ensure you have completed all the steps in the following documents before continuing:
You should still be in the Dataflow Editor interface from the previous chapter.
Create Demo Dataflows on the Local Broker
Make sure your Raspberry Pi is connected and running (with green status LEDs) before starting this section. If not, ask the instructor for assistance.
Publish Unfiltered Local Sensor Data
- Select
... > l-broker > downstream > dataflow - Right-click on
dataflowand selectCreate Dataflow - Name the dataflow
publish-local-sensorand clickInvoke - Expand
... > dataflow > publish-local-sensor - Open the
publish-local-sensordataflow in the right-hand editor workspace by clicking on its dataflow icon - Expand
... > l-broker > downstream > mqtt > local-broker > Data > sensor
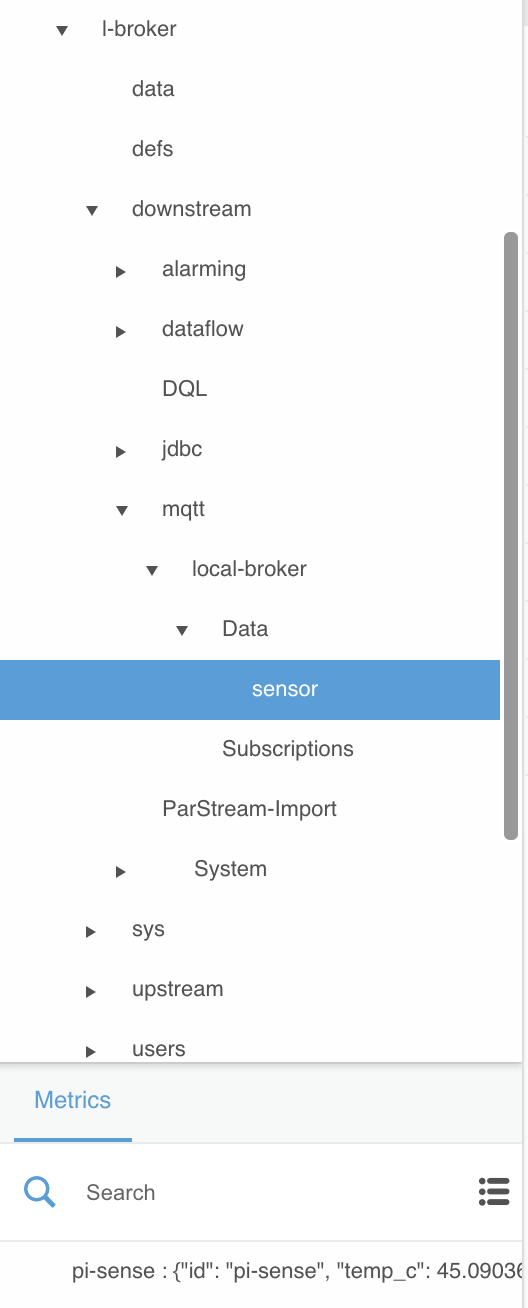
- Under the
Metricssection, dragpi-senseto the editor workspaceDataflowsection
If you don’t see any data listed under
Metricsfrompi-sensecheck that the Raspberry Pi is powered on and the status LEDs are green. Make sure you have correctly set up the MQTT DSLink and MQTT configuration as detailed above as well.
If you do see
pi-sensedata listed, you probably noticed that it is changing every 3 seconds. The EFM Dataflow Editor shows data updates in realtime.
- Double-click on the new block and rename
pi_sensetopi-sense-sensor-mqtt - In the right-hand
Propertiessection, mouse over thelastUpdatefield until a blue dot appears

- Click on the blue dot and check the
Pinnedbox

Pinning a field adds it to that block’s listed fields in the Dataflow section so it is easy to link it to the input field of other blocks.

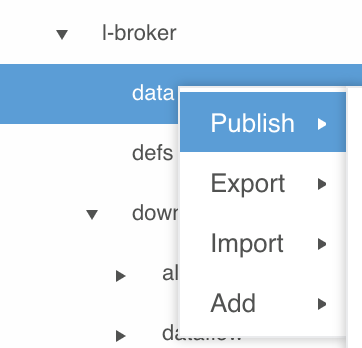
- Navigate to
... > l-broker > data - Right-click on
dataand dragpublishto the editor workspaceDataflowsection
- Select the new block and edit the following values in the right-hand
Propertiessection:
- autoRun:
true - Path:
/data/sensor/pi-sense
Make sure you are updating the
Pathproperty toward the bottom and not thepathproperty near the middle of thePropertiessection. ThePathis how other EFM brokers are able to subscribe to the local broker’s published data.
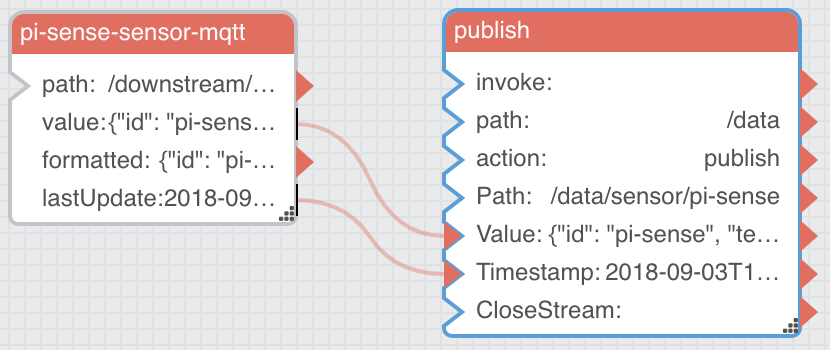
- Link the pi-sense-sensor-mqtt
valuefield to the publishValuefield by dragging the red arrowhead from one block to the open spot on the other

If you ever accidentally link the wrong fields, you can simply double-click the arrowhead and the link will be removed. If you ever drag the wrong block to the editor workspace
Dataflowsection, just select the block and hit the delete key on your keyboard.
- Link the pi—sense-sensor-mqtt
lastUpdatefield to the publishTimestampfield
You can confirm that the data is successfully published by navigating to
... > l-broker > dataand expanding thesensor > pi-senseentry under theMetricssection. The data values should change every 3 seconds, just like the source data. This is an example of how EFM can publish data upstream as it is received locally without modification. The next dataflow will add some additional filtering logic to its publish activity.
- Close the
publish-local-sensordataflow by clicking thexicon next to its name above the editor workspace
Publish Filtered Local Control Data
- Select
... > l-broker > downstream > dataflow - Right-click on
dataflowand selectCreate Dataflow - Name the dataflow
publish-local-controland clickInvoke - Expand
... > dataflow > publish-local-control - Open the
publish-local-controldataflow in the right-hand editor workspace by clicking on its dataflow icon - Expand
... > l-broker > downstream > mqtt > local-broker > Data > control - Actuate (move around) the Raspberry Pi Sense HAT joystick to make some control data appear
- Under the
Metricssection, dragpi-senseto the editor workspaceDataflowsection
If you don’t see any data listed under
Metricsfrompi-sensewhen actuating the joystick check if thesensorMQTT data is still coming in every 3 seconds. If not, double-check the status LEDs on the Raspberry Pi and make sure it is still connected to the MQTT server. Ask the instructor for assistance if needed.
- Double-click on the new block and rename
pi_sensetopi-sense-control-mqtt - In the right-hand
Propertiessection, mouse over thelastUpdatefield until a blue dot appears - Click on the blue dot and check the
Pinnedbox - Under the
Blockssection, expandTable Operations - Drag
JSON Parserto the editor workspaceDataflowsection
This block will parse the JSON data that is received over MQTT and convert it into table format. Take a minute to look at all the different blocks that are available for dataflow logic and processing. As you create progressively more complex dataflows below you will become familiar with many of these blocks.
- Double-click on the new block and rename
jsonParsertocontrol-table - Link the pi-sense-control-mqtt
valuefield to the control-tableinputfield - Navigate to
... > l-broker > data - Right-click on
dataand dragpublishto the editor workspaceDataflowsection - Select the new block and edit the following values in the right-hand
Propertiessection:
- autoRun:
true - Path:
/data/control/pi-sense
- Mouse over the
enabledfield in thePropertiessection until a blue dot appears - Click on the blue dot and check the
Pinnedbox - Under the
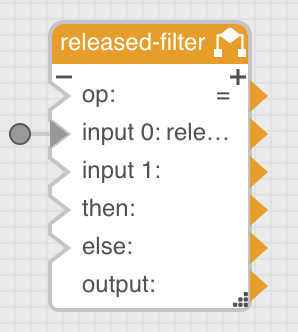
Blockssection, dragLogic > Ifto the editor workspaceDataflowsection - Double-click on the new block and rename
iftoreleased-filter - Select
control-tableand click on theTablebutton for theoutputfield in thePropertiessection to see the underlying table data
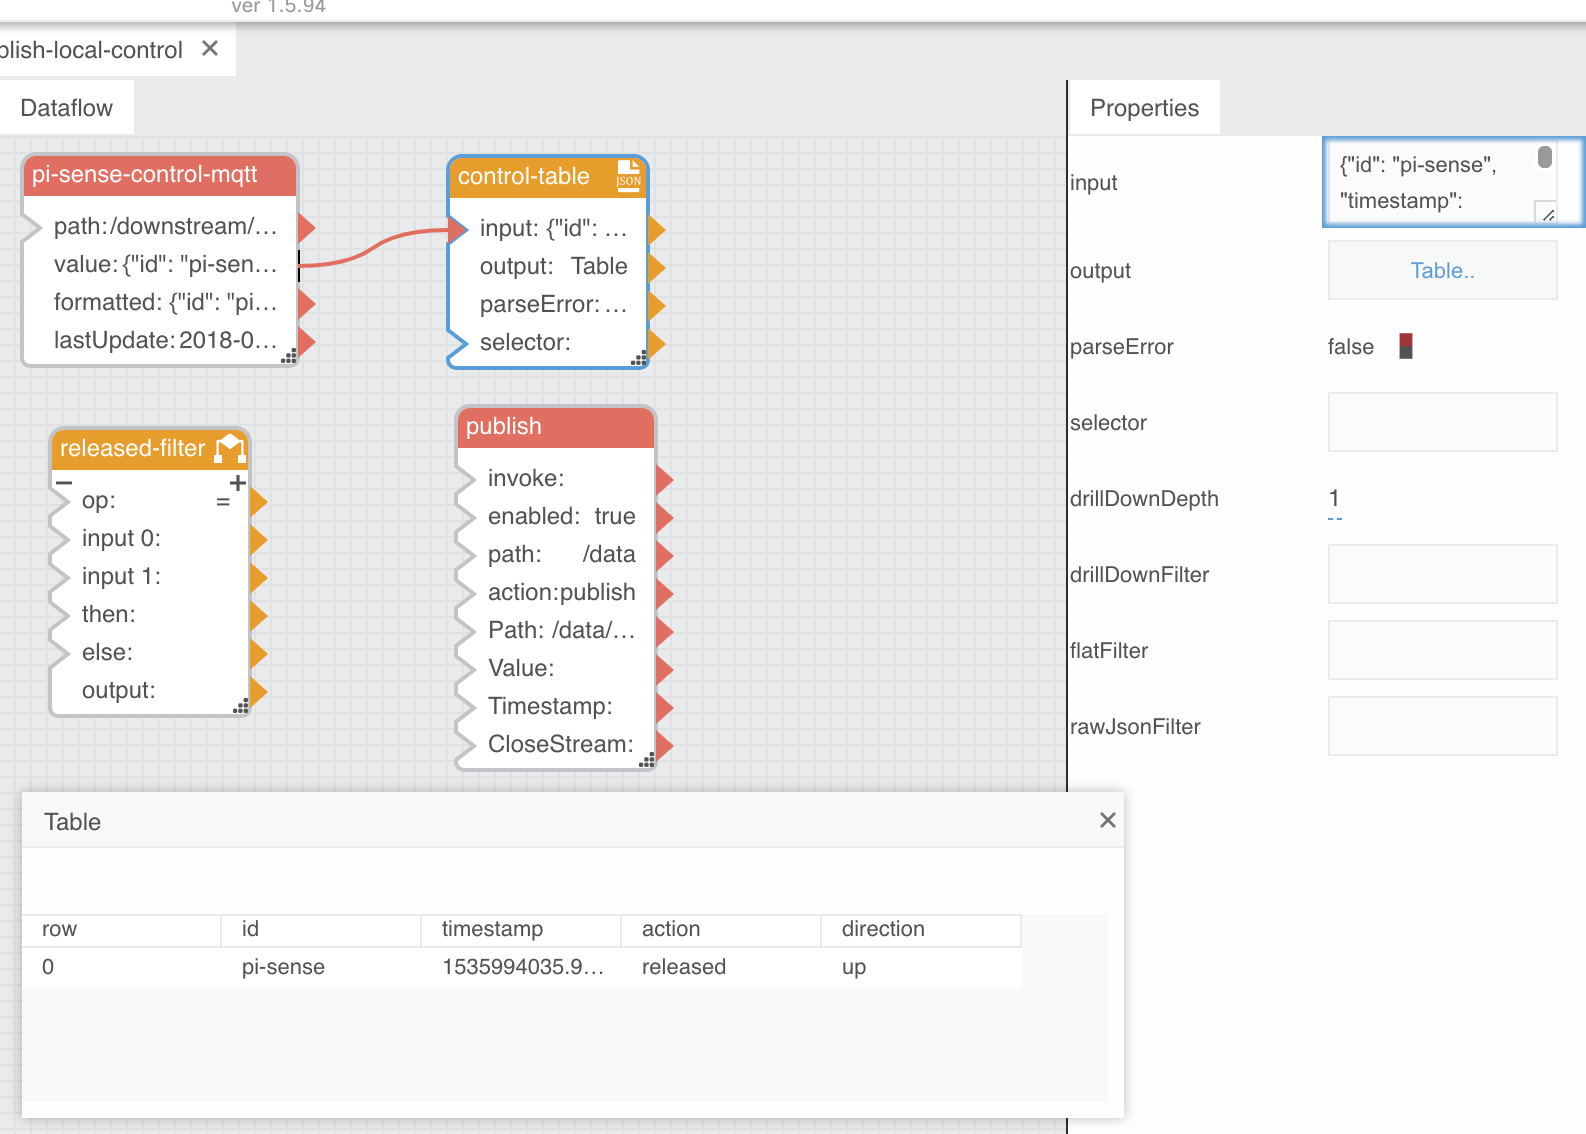
- Drag the value in row 0 for the
actioncolumn to the released-filterinput 0field
The resulting field input 0 indicator for the
released-filterblock will be gray with a circle indicating it’s from an external resource that can’t be easily represented graphically within the dataflow editor.
- Close the table dialog
- Select
released-filterand edit the following values in the right-handPropertiessection:
- input 1:
released - then:
true - else:
false
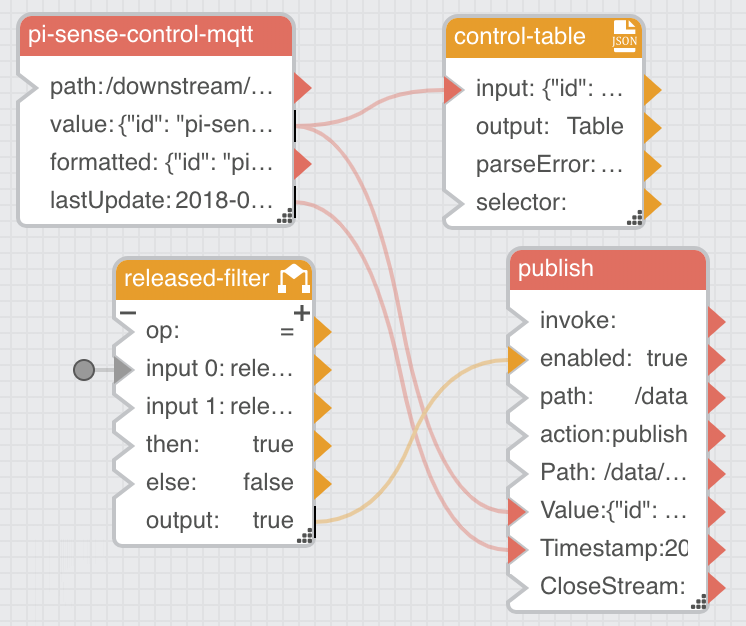
This one
ifblock is providing the main logic for this dataflow. It is evaluating the joystick action and filtering out onlyreleasedevents. This will prevent publishing unnecessarypressedandheldjoystick events when we link this logic to the publish block.
Most dataflows can be broken down logically to an “input-logic-output” cycle. It can be helpful to keep this in mind when trying to understand more complex dataflows. You may have also noticed that data-oriented dataflow blocks (usually used for input and output) are red while logic and operations blocks are orange.
- Link the released-filter
outputfield to the publishenabledfield - Link the pi-sense-control-mqtt
valuefield to the publishValuefield - Link the pi-sense—control-mqtt
lastUpdatefield to the publishTimestampfield
- Actuate the Sense HAT joystick
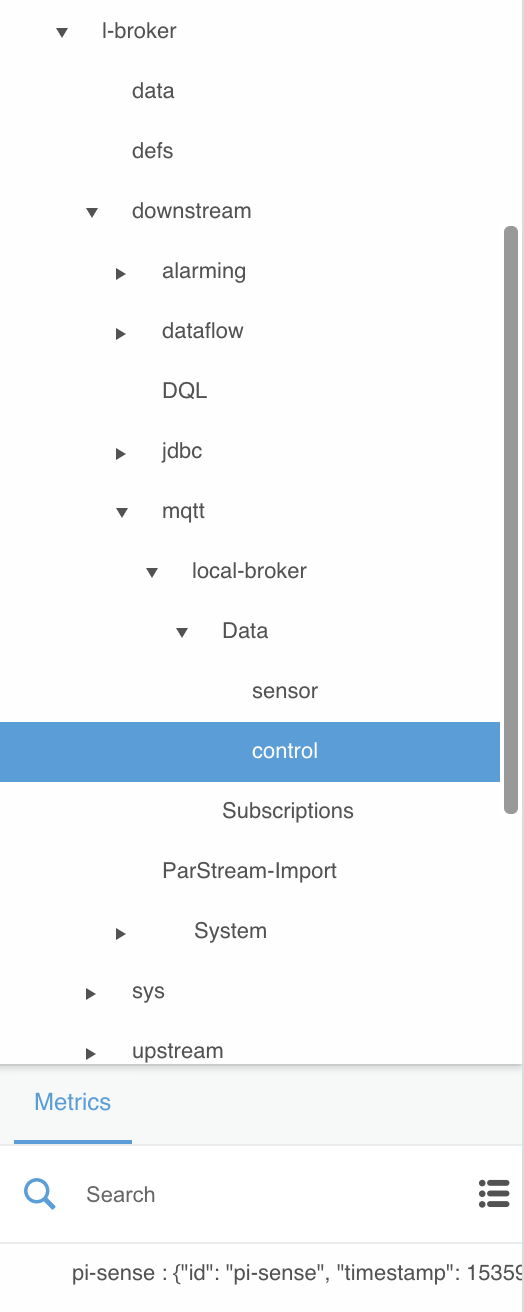
You can confirm the data is successfully published by navigating to
... > l-broker > dataand expanding thecontrol > pi-senseentry under theMetricssection. The data values should change with each completed joystick move, but only showreleasedevents. You can confirm this within thepublish-local-controldataflow as well, watching theenabledfield in thepublishblock, which should change totrueduringreleasedevents and stayfalseotherwise.
This is an example of how EFM can intelligently filter input data streams locally before they are published upstream, which is especially critical for input data that comes at an extremely high rate or is likely to contain invalid or operationally uninteresting data. The next dataflow will use even more logic to tie filtered local control actions to local display output at the edge.
- Close the
publish-local-controldataflow by clicking thexicon next to its name above the editor workspace
Local Control-Display Integration
- Select
... > l-broker > downstream > dataflow - Right-click on
dataflowand selectCreate Dataflow - Name the dataflow
local-control-displayand clickInvoke - Expand
... > dataflow > local-control-display - Open the
local-control-displaydataflow in the right-hand editor workspace by clicking on its dataflow icon - Expand
... > l-broker > downstream > mqtt > local-broker > Data > control - Under the
Metricssection, dragpi-senseto the editor workspaceDataflowsection - Double-click on the new block and rename
pi_sensetopi-sense-control-mqtt - In the right-hand
Propertiessection, mouse over thelastUpdatefield until a blue dot appears - Click on the blue dot and check the
Pinnedbox - Under the
Blockssection, expandTable Operations - Drag
JSON Parserto the editor workspaceDataflowsection - Double-click on the new block and rename
jsonParsertocontrol-table - Link the pi-sense-control-mqtt
valuefield to the control-tableinputfield - Under the
Blockssection, dragLogic > Ifto the editor workspaceDataflowsection - Double-click on the new block and rename
iftoheld-filter - Select
held-filterand edit the following values in the right-handPropertiessection:
- input 1:
held - then:
true - else:
false
Does this process seem similar to the last dataflow? It is almost identical except the
iflogic will filter forheldevents instead ofreleasedand there is nopublishblock (yet). The rest of the dataflow will be new.
- Under the
Blockssection, dragLogic > Caseto the editor workspaceDataflowsection - Double-click on the new block and rename
casetotranslate-direction - Click the small plus icon in upper-right of the
translate-directionblock (3) times to make three more cases appear
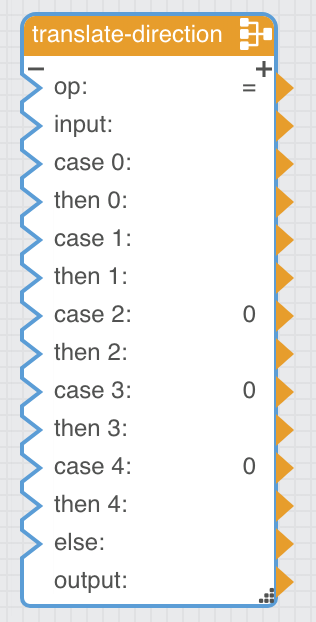
The
Caseblock allows for evaluating a single input value against an arbitrary number of different known cases and provides distinct output values for each one. Here you will be using theCaseblock to translate the publisheddirectioninto a prettier value that will be displayed on the Sense HAT LED matrix.
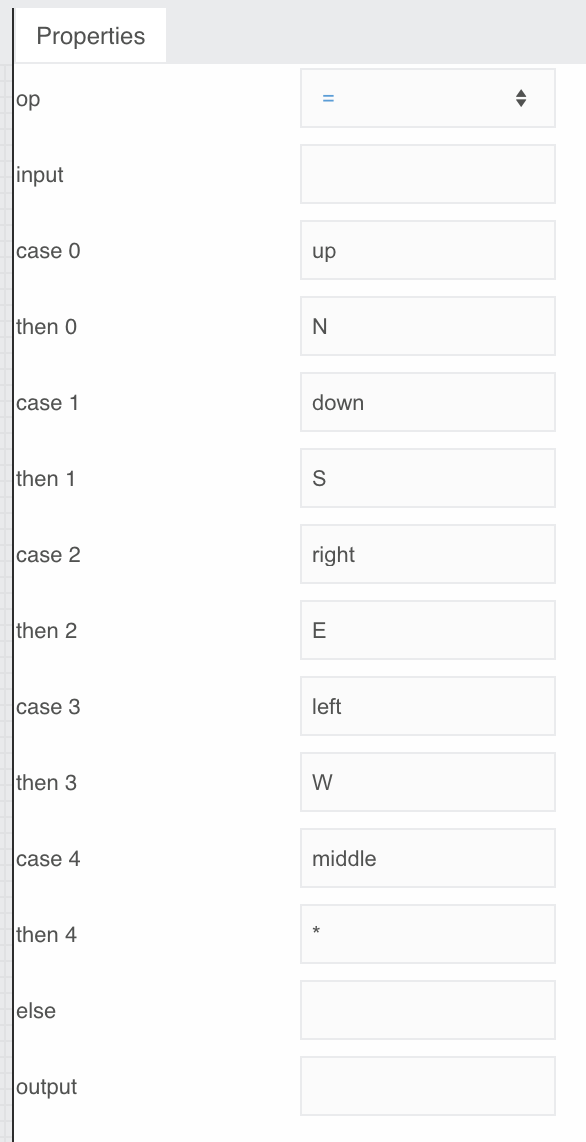
- Select
translate-directionand edit the following values in the right-handPropertiessection:
- case 0:
up - then 0:
N - case 1:
down - then 1:
S - case 2:
right - then 2:
E - case 3:
left - then 3:
W - case 4:
middle - then 4:
*
- Select
control-tableand click on theTablebutton for theoutputfield in thePropertiessection to see the underlying table data - Drag the value in row 0 for the
actioncolumn to the held-filterinput 0field - Drag the value in row 0 for the
directioncolumn to the translate-directioninputfield - Close the table dialog
- Under the
Blockssection, dragString Operations > Concatenateto the editor workspaceDataflowsection - Double-click on the new block and rename
concattodisplay-json - Click the small plus icon in the upper-right of the
display-jsonblock (1) time to make another input field appear
The
Concatentateblock joins text strings together in the input order listed. You will use it to form the JSON message that will be published to thedisplaytopic via MQTT back to the Raspberry Pi so it will display the specified text message.
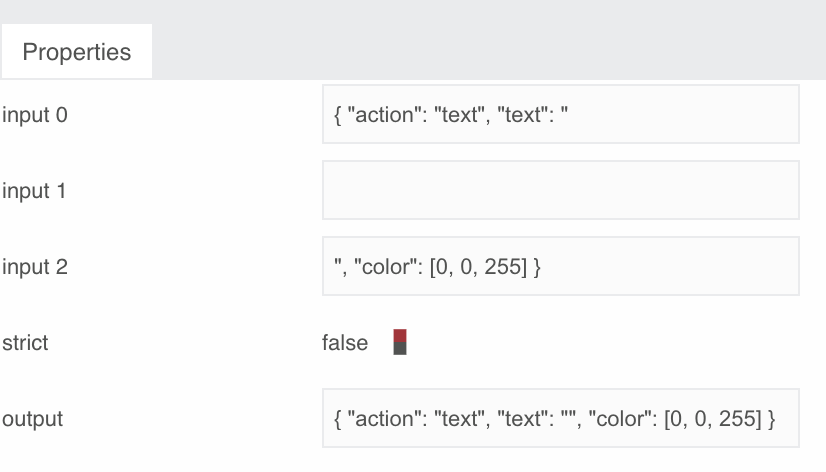
- Select
display-jsonand edit the following values in the right-handPropertiessection:
- input 0:
{ "action": "text", "text": " - input 2:
", "color": [0, 0, 255] }
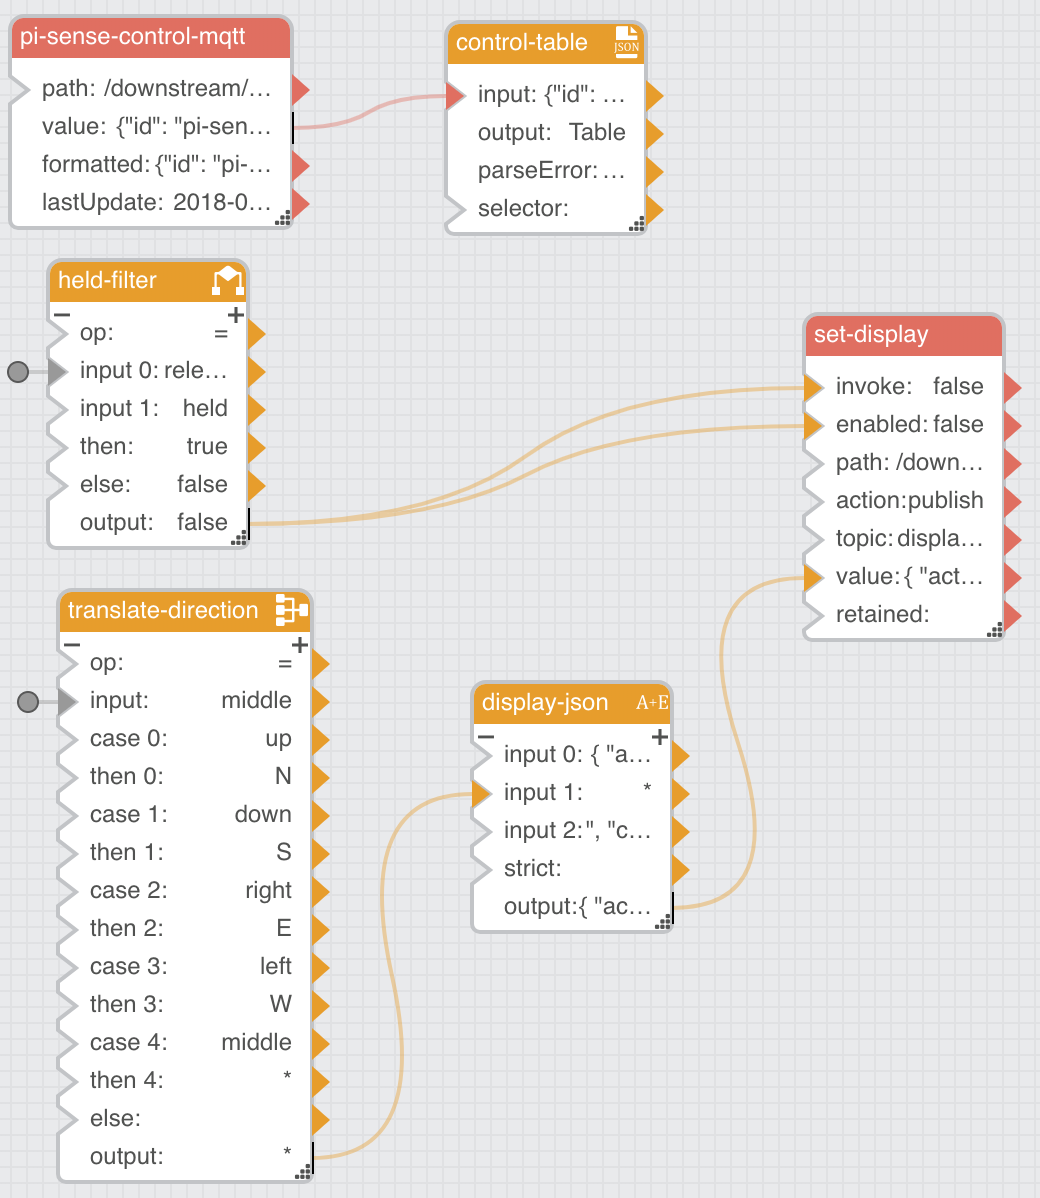
- Link the translate-direction
outputfield to the display-jsoninput 1field - Expand
... > l-broker > downstream > mqtt > local-broker - Right-click on
local-brokerand drag thePublishaction to the editor workspaceDataflowsection

- Double-click the new block and rename
publishtoset-display - Select
set-displayand edit the following values in the right-handPropertiessection:
- topic:
display/pi-sense
- Mouse over the
enabledfield in thePropertiessection until a blue dot appears - Click on the blue dot and check the
Pinnedbox - Link the held-filter
outputfield to the set-displayenabledfield - Link the held-filter
outputfield to the set-displayinvokefield
Why use both the
enabledandinvokefields for this block? This approach will “debounce” the joystick output so that only direction changes are pushed to the display rather than an ongoing set of joystickheldevents, which would overwhelm the display with continuous messages.
- Link the display-json
outputfield to the set-displayvaluefield
- Hold the joystick toward a certain direction and confirm that the Sense HAT displays the appropriate message
If the Sense HAT is blank, double-check your
display-jsonblock and make sure there are no typos in theinput 0andinput 2fields. Ask the instructor for help if you get stuck.
This dataflow showcases a major feature of Kinetic EFM and fog computing: the ability to resiliently perform a multi-part input-logic-output cycle with both filtering and translation entirely at the edge in the local broker. If this were a roadway, factory, utility substation, or offshore drilling platform, this entire dataflow would continue to run locally even if the upstream connection were disrupted.
- Close the
local-control-displaydataflow by clicking thexicon next to its name above the editor workspace